Analisando Diferentes Parâmetros de Saída para a Estratégia de IFR2
No último artigo da série de backtests da estratégia de IFR2, testamos diferentes parâmetros do indicador como pontos de entrada. Hoje, analisaremos diferentes pontos de saída, dessa vez baseados no valor do IFR2. Dessa forma, o objetivo será vender no fechamento sempre que o IFR2 do ativo atingir os valores de 50, 60, 70 ou 80. Além disso, incluiremos diferentes parâmetros de stop loss no tempo (3, 5, 7 e 9 períodos).
Importando as bibliotecas e baixando os dados necessários
Para não criarmos nenhum tipo de viés na nossa análise, utilizaremos o mesmo ativo (LREN3.SA) e intervalo de tempo (início de 2015 ao fim de 2020) do último backtest.
# %%capture means we suppress the output
%%capture

import pandas as pd
import numpy as np
import matplotlib.pyplot as plt
!pip install yfinance
import yfinance as yf
df = yf.download("LREN3.SA", start="2015-01-01", end="2020-12-30").copy()[["Close"]]
df
[*********************100%***********************] 1 of 1 completed
| Close | |
|---|---|
| Date | |
| 2015-01-02 | 12.545500 |
| 2015-01-05 | 12.196700 |
| 2015-01-06 | 12.337200 |
| 2015-01-07 | 12.547100 |
| 2015-01-08 | 12.562000 |
| ... | ... |
| 2020-12-21 | 43.950001 |
| 2020-12-22 | 43.160000 |
| 2020-12-23 | 43.720001 |
| 2020-12-28 | 43.970001 |
| 2020-12-29 | 44.130001 |
1487 rows × 1 columns
Calculando o IFR para 2 períodos
Utilizando a função rsi(), calcularemos o IFR para 2 períodos e adicionaremos uma nova coluna ao dataframe.
Se você ainda não está familiarizado com o indicador ou com o código a seguir, não deixe de ler o primeiro artigo da série de backtests do IFR2.
def rsi(data, column, window=2):

    data = data.copy()

    # Establish gains and losses for each day
    data["Variation"] = data[column].diff()
    data = data[1:]
    data["Gain"] = np.where(data["Variation"] > 0, data["Variation"], 0)
    data["Loss"] = np.where(data["Variation"] < 0, data["Variation"], 0)

    # Calculate simple averages so we can initialize the classic averages
    simple_avg_gain = data["Gain"].rolling(window).mean()
    simple_avg_loss = data["Loss"].abs().rolling(window).mean()
    classic_avg_gain = simple_avg_gain.copy()
    classic_avg_loss = simple_avg_loss.copy()

    for i in range(window, len(classic_avg_gain)):
        classic_avg_gain[i] = (classic_avg_gain[i - 1] * (window - 1) + data["Gain"].iloc[i]) / window
        classic_avg_loss[i] = (classic_avg_loss[i - 1] * (window - 1) + data["Loss"].abs().iloc[i]) / window

    # Calculate the RSI
    RS = classic_avg_gain / classic_avg_loss
    RSI = 100 - (100 / (1 + RS))

    return RSI
df["IFR2"] = rsi(data=df, column="Close")
df.head()| Close | IFR2 | |
|---|---|---|
| Date | ||
| 2015-01-02 | 12.5455 | NaN |
| 2015-01-05 | 12.1967 | NaN |
| 2015-01-06 | 12.3372 | 28.714517 |
| 2015-01-07 | 12.5471 | 61.632398 |
| 2015-01-08 | 12.5620 | 63.993026 |
Criando a função que irá definir os pontos de entrada e saída
Nosso ponto de entrada será o parâmetro clássico de IFR2, caracterizado por valores iguais ou menores que 30. Assim:
- Ponto de entrada: o preço de compra (
Buy Price) será igual ao preço de fechamento (data["Close"]), se o valor de IFR2 for menor ou igual a 30 (data["IFR2"] <= rsi_parameter_entry); - Ponto de saída: o preço de venda (
Sell Price) será igual ao preço de fechamento, se o valor de IFR2 for maior ou igual ao valor estabelecido a partir da variávelrsi_parameter_exit.
def strategy_points(data, rsi_parameter_entry, rsi_parameter_exit):

 # Define exact buy price
 data["Buy Price"] = np.where(data["IFR2"] <= rsi_parameter_entry, data["Close"], np.nan)

 # Define exact sell price
 data["Sell Price"] = np.where(data["IFR2"] >= rsi_parameter_exit, data["Close"], np.nan)

 return data
Criando as funções necessárias para o backtest
As três funções a seguir foram elaboradas no último artigo. Para uma explicação mais detalhada, não deixe de ler o post Analisando Diferentes Parâmetros de Entrada para a Estratégia de IFR2.
Simulação das operações
A função backtest_algorithm retorna duas listas:
all_profits, que compreende o lucro de cada operação;- e
total_capital, com o capital acumulado após cada operação.
import math

# Create a function to round any number to the smallest multiple of 100
def round_down(x):
  return int(math.floor(x / 100.0)) * 100

def backtest_algorithm(data, initial_capital=10000):

  # List with the total capital after every operation
  total_capital = [initial_capital]

  # List with profits for every operation. We initialize with 0 so
  # both lists have the same size
  all_profits = [0]

  ongoing = False

  for i in range(0,len(data)):
    if ongoing == True:
      if ~(np.isnan(data['Sell Price'][i])):

        # Define exit point and total profit
        exit = data['Sell Price'][i]
        profit = shares * (exit - entry)

        # Append profit to list and create a new entry with the capital
        # after the operation is complete
        all_profits += [profit]
        current_capital = total_capital[-1] # current capital is the last entry in the list
        total_capital += [current_capital + profit]
        ongoing = False

    else:
      if ~(np.isnan(data['Buy Price'][i])):
        entry = data['Buy Price'][i]
        shares = round_down(initial_capital / entry)
        ongoing = True

  return all_profits, total_capital
Cálculo do Drawdown
A função abaixo é explicada no post Entenda o Drawdown e Calcule essa Medida de Volatilidade para Qualquer Ativo.
def get_drawdown(data, column = "Adj Close"):
  data["Max"] = data[column].cummax()
  data["Delta"] = data['Max'] - data[column]
  data["Drawdown"] = 100 * (data["Delta"] / data["Max"])
  max_drawdown = data["Drawdown"].max()
  return max_drawdown
Cálculo das Estatísticas
A função strategy_test retorna os seguintes valores:
- número total de operações (
num_operation); - número de operações que deram lucro e prejuízo (
gainselosses); - suas respectivas porcentagens (
pct_gainsepct_losses); - lucro total (
total_profit); - e o drawdown máximo (
drawdown).
def strategy_test(all_profits, total_capital):
    num_operations = (len(all_profits) - 1)
    gains = sum(x >= 0 for x in all_profits)
    pct_gains = 100 * (gains / num_operations)
    losses = num_operations - gains
    pct_losses = 100 - pct_gains
    total_profit = sum(all_profits)

    # The first value entry in total_capital is the initial capital
    pct_profit = (total_profit / total_capital[0]) * 100

    # Compute drawdown
    total_capital = pd.DataFrame(data=total_capital, columns=["total_capital"])
    drawdown = get_drawdown(data=total_capital, column="total_capital")

    return {
      "num_operations": num_operations,
      "gains": gains ,
      "pct_gains": pct_gains.round(),
      "losses": losses,
      "pct_losses": pct_losses.round(),
      "total_profit": total_profit,
      "pct_profit": pct_profit,
      "drawdown": drawdown
    }
Realizando o backtest
Para o backtest, iremos iterar sobre nossa lista de parâmetros (parameters), definir os pontos de entrada e saída, simular as operações e armazenar o resultado num dicionário (statistics).
parameters = [50, 60, 70, 80]

statistics = {}

for parameter in parameters:
  df = strategy_points(data=df, rsi_parameter_entry=30, rsi_parameter_exit=parameter)
  all_profits, total_capital = backtest_algorithm(df)
  statistics[parameter] = strategy_test(all_profits, total_capital)

statistics
{50: {'num_operations': 175, 'gains': 122, 'pct_gains': 70.0, 'losses': 53, 'pct_losses': 30.0, 'total_profit': 11989.375114440918, 'pct_profit': 119.8937511444092, 'drawdown': 16.131150979882893}, 60: {'num_operations': 155, 'gains': 112, 'pct_gains': 72.0, 'losses': 43, 'pct_losses': 28.0, 'total_profit': 10482.694911956787, 'pct_profit': 104.82694911956787, 'drawdown': 14.474284150892295}, 70: {'num_operations': 138, 'gains': 100, 'pct_gains': 72.0, 'losses': 38, 'pct_losses': 28.0, 'total_profit': 12148.157978057861, 'pct_profit': 121.48157978057861, 'drawdown': 11.42124524302571}, 80: {'num_operations': 113, 'gains': 81, 'pct_gains': 72.0, 'losses': 32, 'pct_losses': 28.0, 'total_profit': 14945.658779144287, 'pct_profit': 149.45658779144287, 'drawdown': 10.25379130317439}}O próximo passo é transformar esse dicionário em um dataframe. Para isso, utilizaremos a função pd.DataFrame.from_dict(), na qual será determinado que as chaves corresponderão ao índice (orient='index'). Iremos também limitar os valores a duas casas decimais através da função .round(), melhorando assim, a visualização dos dados mais relevantes.
statistics_df = pd.DataFrame.from_dict(statistics, orient='index')
statistics_df = statistics_df.round(2)
statistics_df
| num_operations | gains | pct_gains | losses | pct_losses | total_profit | pct_profit | drawdown | |
|---|---|---|---|---|---|---|---|---|
| 50 | 175 | 122 | 70.0 | 53 | 30.0 | 11989.38 | 119.89 | 16.13 |
| 60 | 155 | 112 | 72.0 | 43 | 28.0 | 10482.69 | 104.83 | 14.47 |
| 70 | 138 | 100 | 72.0 | 38 | 28.0 | 12148.16 | 121.48 | 11.42 |
| 80 | 113 | 81 | 72.0 | 32 | 28.0 | 14945.66 | 149.46 | 10.25 |
A seguir, utilizando a mesma função do último backtest (plot_bars), plotaremos o lucro total (pct_profit) e o drawdown máximo (drawdown).
def plot_bars(title, x, y, x_label="IFR2", y_label=None):
  fig = plt.figure()
  plt.gca().spines['right'].set_visible(False)
  plt.gca().spines['top'].set_visible(False)

  colors = ["paleturquoise", "mediumturquoise", "darkcyan", "darkslategrey"]
  plt.bar(x, y, color=colors)

  plt.title(title)
  plt.xlabel(x_label)
  if y_label != None:
    plt.ylabel(y_label)

  for i, v in enumerate(y):
    plt.text(
      x=i,
      y=v,
      s=str(v),
      horizontalalignment='center',
      verticalalignment='bottom'
    )
x = statistics_df.index.astype(str)
plot_bars(title="Lucro Total %", x=x, y=statistics_df["pct_profit"], x_label="IFR2 de Saída")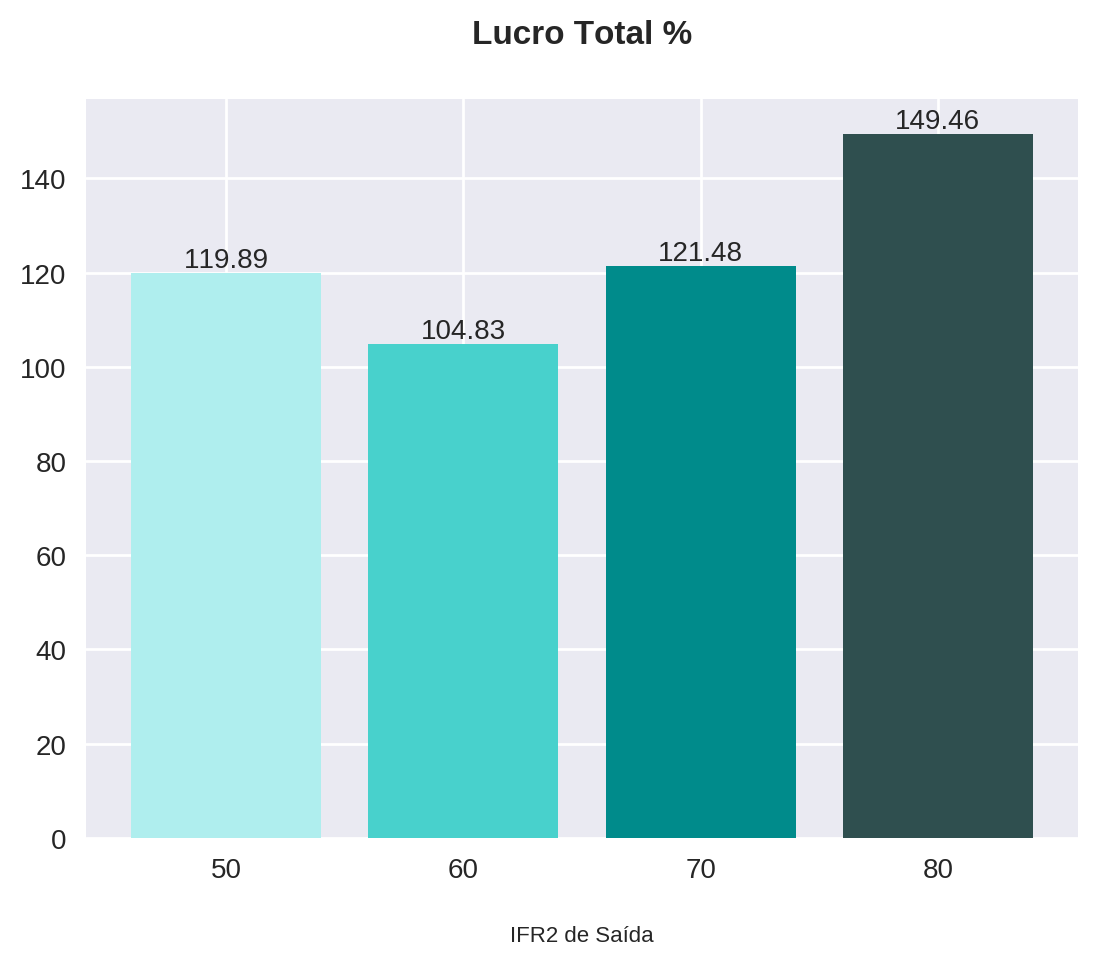
plot_bars(title="Drawdown Máx. %", x=x, y=statistics_df["drawdown"], x_label="IFR2 de Saída")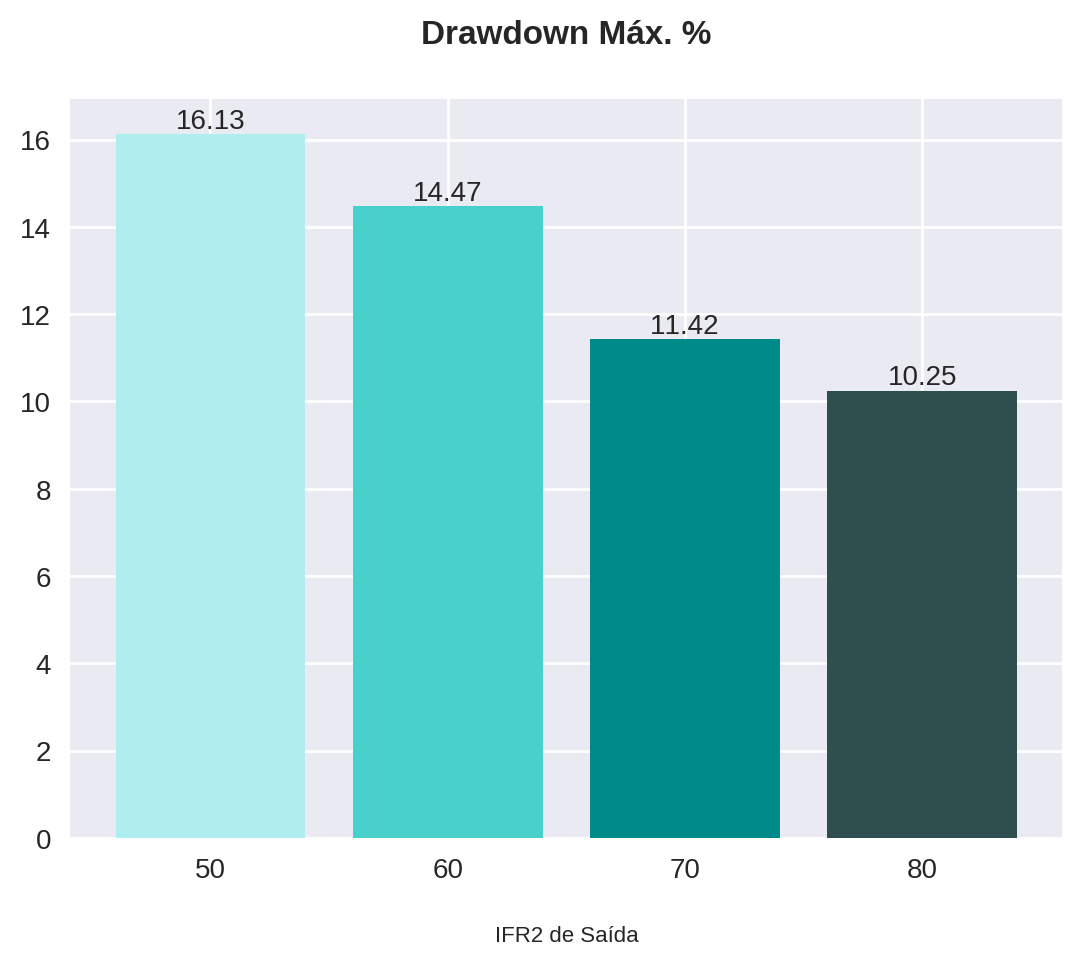
Os gráficos acima nos mostram que a estratégia com a saída no IFR2 igual ou maior a 80 teve o maior lucro e o menor drawdown para o ativo em questão (LREN3). Como já discutido em artigos passados, é de extrema importância que o ativo utilizado para qualquer backtest seja levado em consideração durante a análise técnica.
No período analisado, LREN3 esteve em forte tendência de alta, como podemos observar no gráfico abaixo. Vender o papel apenas com o IFR2 acima de 80, naturalmente nos faz carregar o papel por mais tempo. Uma vez que o ativo subiu consideravelmente no período, é de se esperar que essa estratégia tenha os melhores resultados.
A fins de estudo, tente fazer o mesmo backtest em um papel que apresentou forte desvalorização no período (por exemplo, CIEL3.SA). Te garanto que os resultados serão bem diferentes!
df['Close'].plot(title = "Evolução do preço de LREN3 nos últimos 6 anos", linewidth=0.5)<matplotlib.axes._subplots.AxesSubplot at 0x7fc415898250>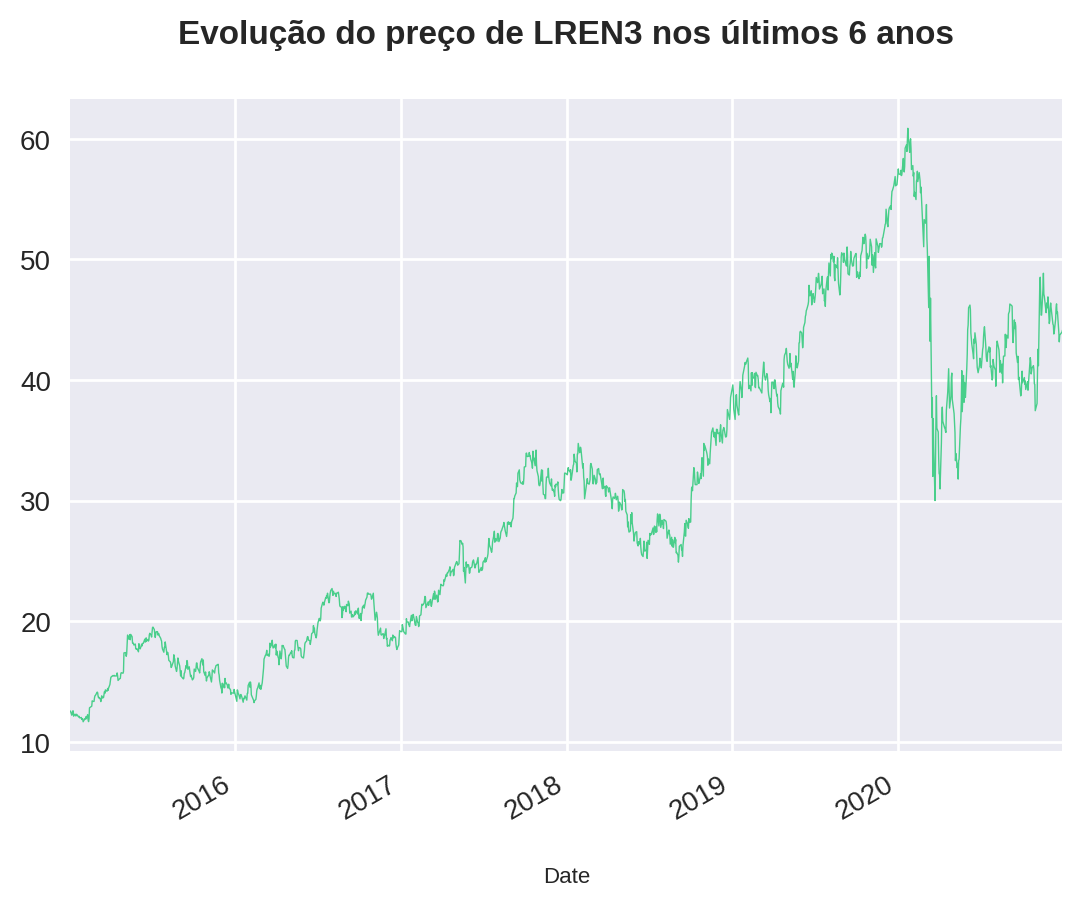
Testando diferentes stops baseados no tempo
Vamos analisar agora como seriam esses resultados caso tívessemos estabelecido um stop baseado no tempo. Isto é, iremos determinar um máximo de dias para uma operação ocorrer, a fim de se expor menos em um único trade. Para embasar ainda mais nossa análise, testaremos em 4 intervalos de tempo diferentes: 3, 5, 7 e 9 dias.
Nós já testamos esse tipo de stop no segundo artigo dessa série. Portanto, iremos apenas inserir o mesmo código dentro de uma função.
Criando a função com stop
A função algorithm_with_stop irá receber apenas três argumentos:
- o dataframe (
data); - o máximo de dias que a operação pode levar (
max_days); - e o capital inicial alocado (
initial_capital), que será R$10.000, por padrão.
def algorithm_with_stop(data, max_days, initial_capital=10000):

  # List with the total capital after every operation
  total_capital = [initial_capital]
  # List with profits for every operation. We initialize with 0 so
  # both lists have the same size
  all_profits = [0]

  days_in_operation = 0

  ongoing = False

  for i in range(0,len(df)):
      if ongoing == True:
          days_in_operation += 1

          # If any of the following conditions are met, the operation will end
          if days_in_operation == max_days or ~(np.isnan(df['Sell Price'][i])):

              # Define exit point and total profit
              exit = np.where(
                  ~(np.isnan(df['Sell Price'][i])),
                  df['Sell Price'][i],
                  df['Close'][i])
              profit = shares * (exit - entry)

              # Append profit to list and create a new entry with the capital
              # after the operation is complete
              all_profits += [profit]
              current_capital = total_capital[-1]
              total_capital += [current_capital + profit]

              ongoing = False
      else:
          if ~(np.isnan(df['Buy Price'][i])):
              entry = df['Buy Price'][i]
              shares = round_down(initial_capital / entry)
              days_in_operation = 0
              ongoing = True

  return all_profits, total_capital
Nós testaremos cada stop (3, 5, 7 e 9) para cada parâmetro de IFR2 como alvo (50, 60, 70 e 80), obtendo ao final, 16 combinações de estratégias. Como vamos trabalhar com um número pequeno de parâmetros, utilizaremos um nested loop, que nada mais é do que um loop dentro do outro.
No primeiro, iremos iterar sobre nossa lista de parâmetros de IFR2, a fim de rodar a função que nos retorna os preços de compra e venda da estratégia. Com essas informações, passamos para o segundo loop, o qual itera sobre a lista de stops. Neste rodaremos o algortimo e toda a estatística, que será armazenada no dicionário backtest.
stops = [3, 5, 7, 9]

backtest = {}

for parameter in parameters:
  df = strategy_points(
    data=df,
    rsi_parameter_entry=30,
    rsi_parameter_exit=parameter
  )

  backtest[parameter] = {}

  for stop in stops:
    all_profits, total_capital = algorithm_with_stop(data=df, max_days=stop)
    backtest[parameter][stop] = strategy_test(all_profits, total_capital)
O backtest caracteriza um "dicionário aninhado" (nested dictionary), onde:
- as chaves do 1º dicionário são os alvos do IFR2;
- as chaves do 2º dicionário são o máximo de dias na operação;
- a combinação das duas chaves acima retorna um dicionário com os dados estatísticos para a estratégia.
Dessa forma, para transformá-lo em um dataframe teremos que utilizar uma indexação hierárquica, na qual teremos dois níveis de índice: os alvos em primeiro nível, e os stops em segundo.
backtest_df = pd.DataFrame.from_dict(
  {(i,j): backtest[i][j] for i in backtest.keys() for j in backtest[i].keys()},
  orient='index'
)
backtest_df
| num_operations | gains | pct_gains | losses | pct_losses | total_profit | pct_profit | drawdown | ||
|---|---|---|---|---|---|---|---|---|---|
| 50 | 3 | 204 | 128 | 63.0 | 76 | 37.0 | 8335.270405 | 83.352704 | 11.330522 |
| 5 | 185 | 130 | 70.0 | 55 | 30.0 | 11354.376030 | 113.543760 | 18.007040 | |
| 7 | 180 | 126 | 70.0 | 54 | 30.0 | 11780.224609 | 117.802246 | 16.622854 | |
| 9 | 175 | 122 | 70.0 | 53 | 30.0 | 11490.674591 | 114.906746 | 16.901341 | |
| 60 | 3 | 196 | 117 | 60.0 | 79 | 40.0 | 5376.551819 | 53.765518 | 19.410560 |
| 5 | 170 | 121 | 71.0 | 49 | 29.0 | 8422.573566 | 84.225736 | 17.154408 | |
| 7 | 164 | 120 | 73.0 | 44 | 27.0 | 11865.434170 | 118.654342 | 13.788915 | |
| 9 | 157 | 114 | 73.0 | 43 | 27.0 | 11368.824673 | 113.688247 | 18.928227 | |
| 70 | 3 | 192 | 108 | 56.0 | 84 | 44.0 | 7035.383511 | 70.353835 | 14.775776 |
| 5 | 162 | 108 | 67.0 | 54 | 33.0 | 10244.797516 | 102.447975 | 13.321478 | |
| 7 | 153 | 111 | 73.0 | 42 | 27.0 | 15221.747208 | 152.217472 | 12.526994 | |
| 9 | 147 | 107 | 73.0 | 40 | 27.0 | 13230.715847 | 132.307158 | 12.501646 | |
| 80 | 3 | 191 | 107 | 56.0 | 84 | 44.0 | 8527.073860 | 85.270739 | 15.154275 |
| 5 | 158 | 102 | 65.0 | 56 | 35.0 | 13309.181976 | 133.091820 | 11.361103 | |
| 7 | 140 | 97 | 69.0 | 43 | 31.0 | 15596.088219 | 155.960882 | 19.545613 | |
| 9 | 131 | 95 | 73.0 | 36 | 27.0 | 15260.956669 | 152.609567 | 15.251329 |
Através da função .set_names(), iremos rotular ambos níveis de index.
backtest_df.index.set_names(['IFR2 de Saída', 'Stop (dias)'], inplace=True)
backtest_df = backtest_df.round(2)
backtest_df
| num_operations | gains | pct_gains | losses | pct_losses | total_profit | pct_profit | drawdown | ||
|---|---|---|---|---|---|---|---|---|---|
| IFR2 de Saída | Stop (dias) | ||||||||
| 50 | 3 | 204 | 128 | 63.0 | 76 | 37.0 | 8335.27 | 83.35 | 11.33 |
| 5 | 185 | 130 | 70.0 | 55 | 30.0 | 11354.38 | 113.54 | 18.01 | |
| 7 | 180 | 126 | 70.0 | 54 | 30.0 | 11780.22 | 117.80 | 16.62 | |
| 9 | 175 | 122 | 70.0 | 53 | 30.0 | 11490.67 | 114.91 | 16.90 | |
| 60 | 3 | 196 | 117 | 60.0 | 79 | 40.0 | 5376.55 | 53.77 | 19.41 |
| 5 | 170 | 121 | 71.0 | 49 | 29.0 | 8422.57 | 84.23 | 17.15 | |
| 7 | 164 | 120 | 73.0 | 44 | 27.0 | 11865.43 | 118.65 | 13.79 | |
| 9 | 157 | 114 | 73.0 | 43 | 27.0 | 11368.82 | 113.69 | 18.93 | |
| 70 | 3 | 192 | 108 | 56.0 | 84 | 44.0 | 7035.38 | 70.35 | 14.78 |
| 5 | 162 | 108 | 67.0 | 54 | 33.0 | 10244.80 | 102.45 | 13.32 | |
| 7 | 153 | 111 | 73.0 | 42 | 27.0 | 15221.75 | 152.22 | 12.53 | |
| 9 | 147 | 107 | 73.0 | 40 | 27.0 | 13230.72 | 132.31 | 12.50 | |
| 80 | 3 | 191 | 107 | 56.0 | 84 | 44.0 | 8527.07 | 85.27 | 15.15 |
| 5 | 158 | 102 | 65.0 | 56 | 35.0 | 13309.18 | 133.09 | 11.36 | |
| 7 | 140 | 97 | 69.0 | 43 | 31.0 | 15596.09 | 155.96 | 19.55 | |
| 9 | 131 | 95 | 73.0 | 36 | 27.0 | 15260.96 | 152.61 | 15.25 |
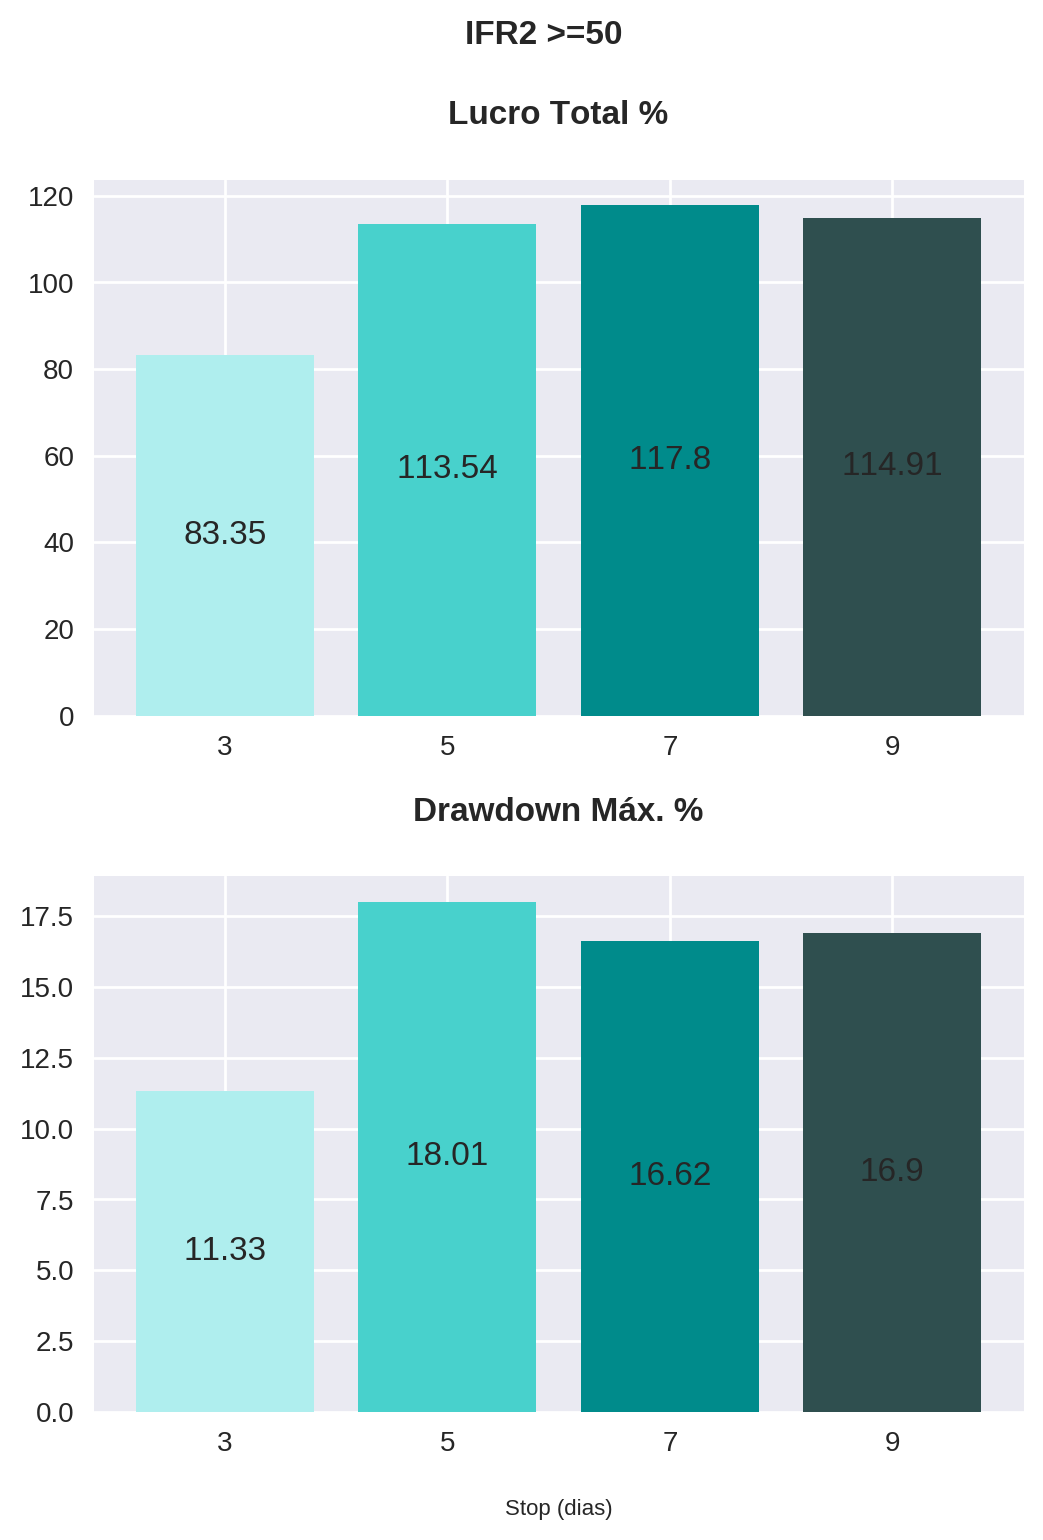
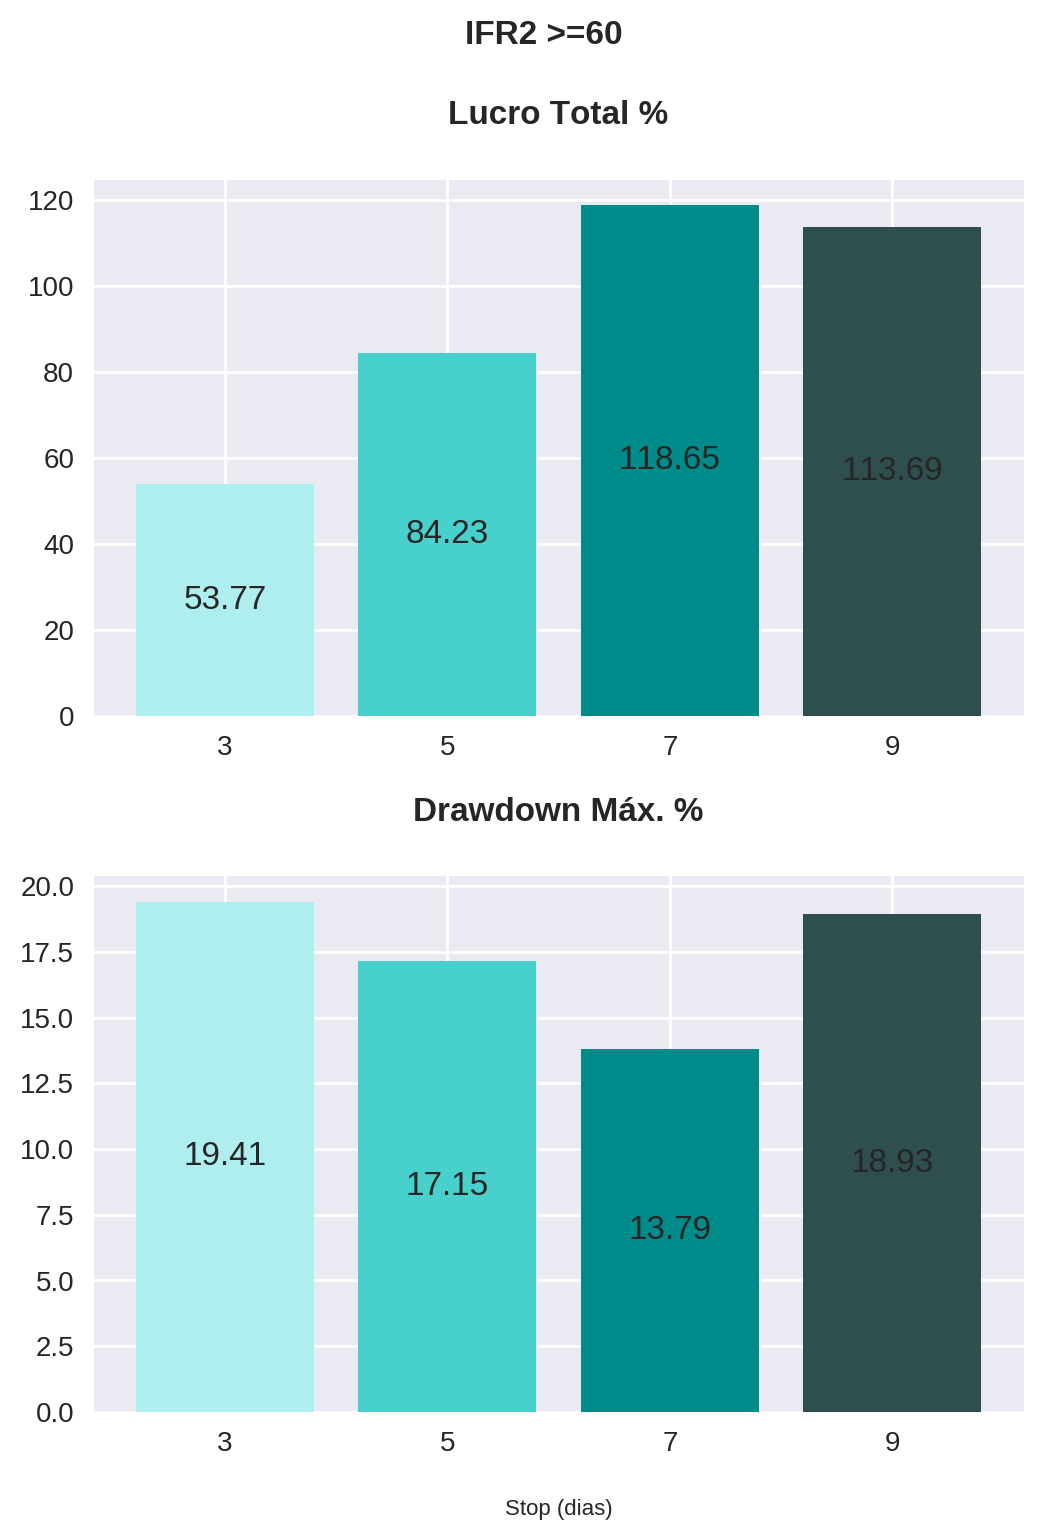
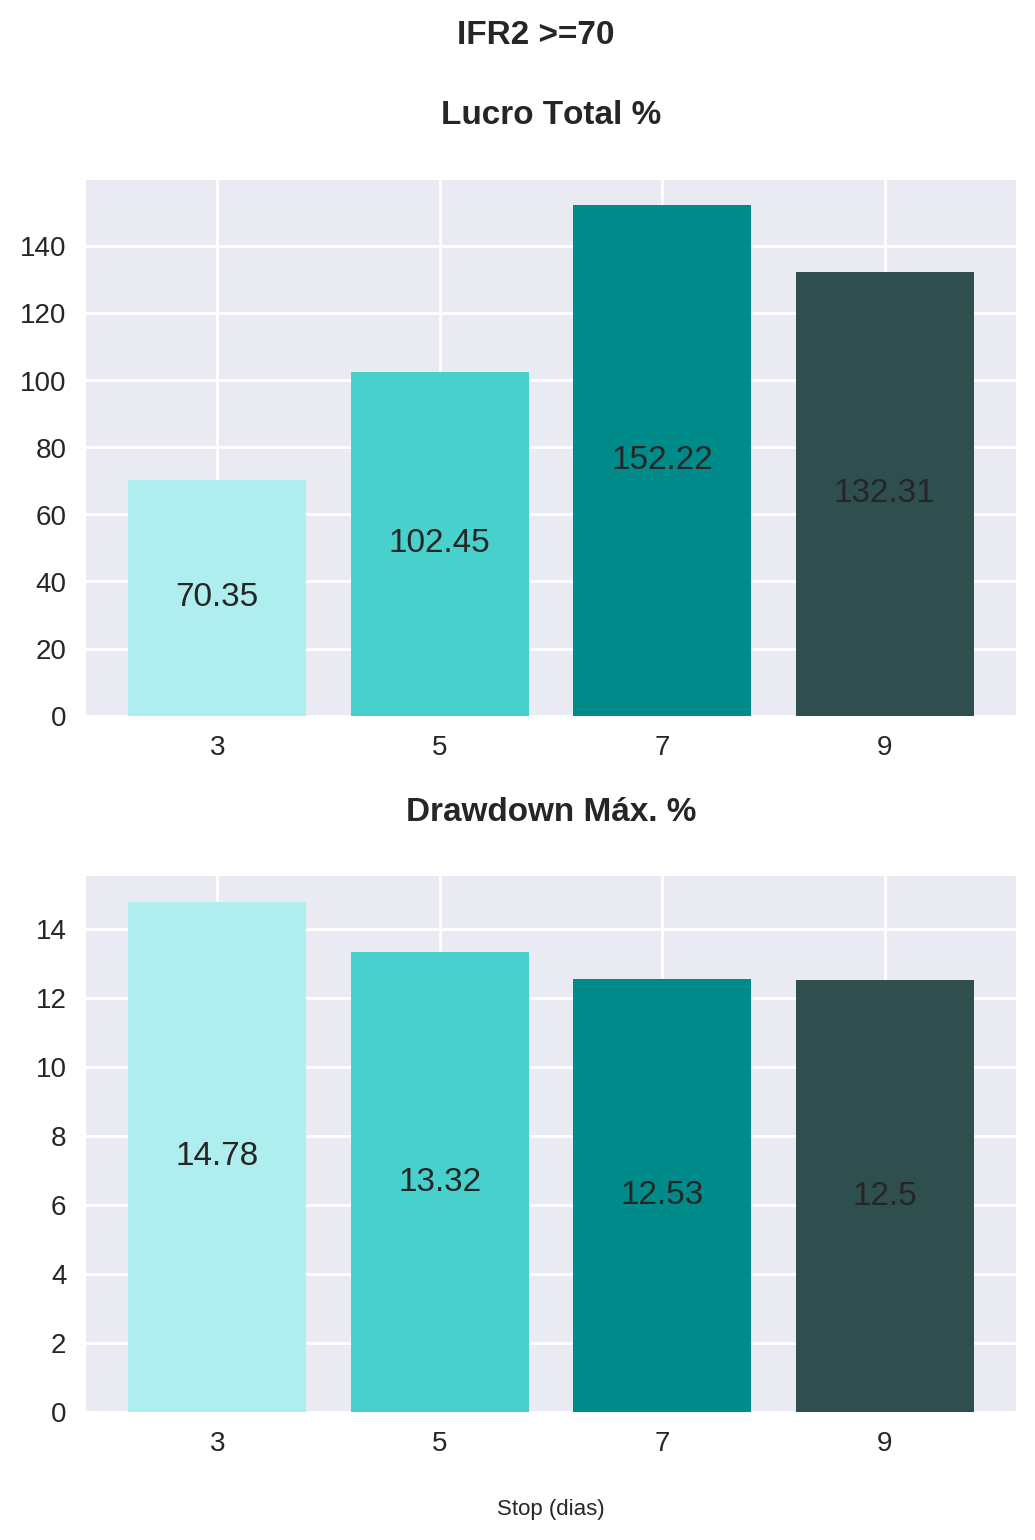
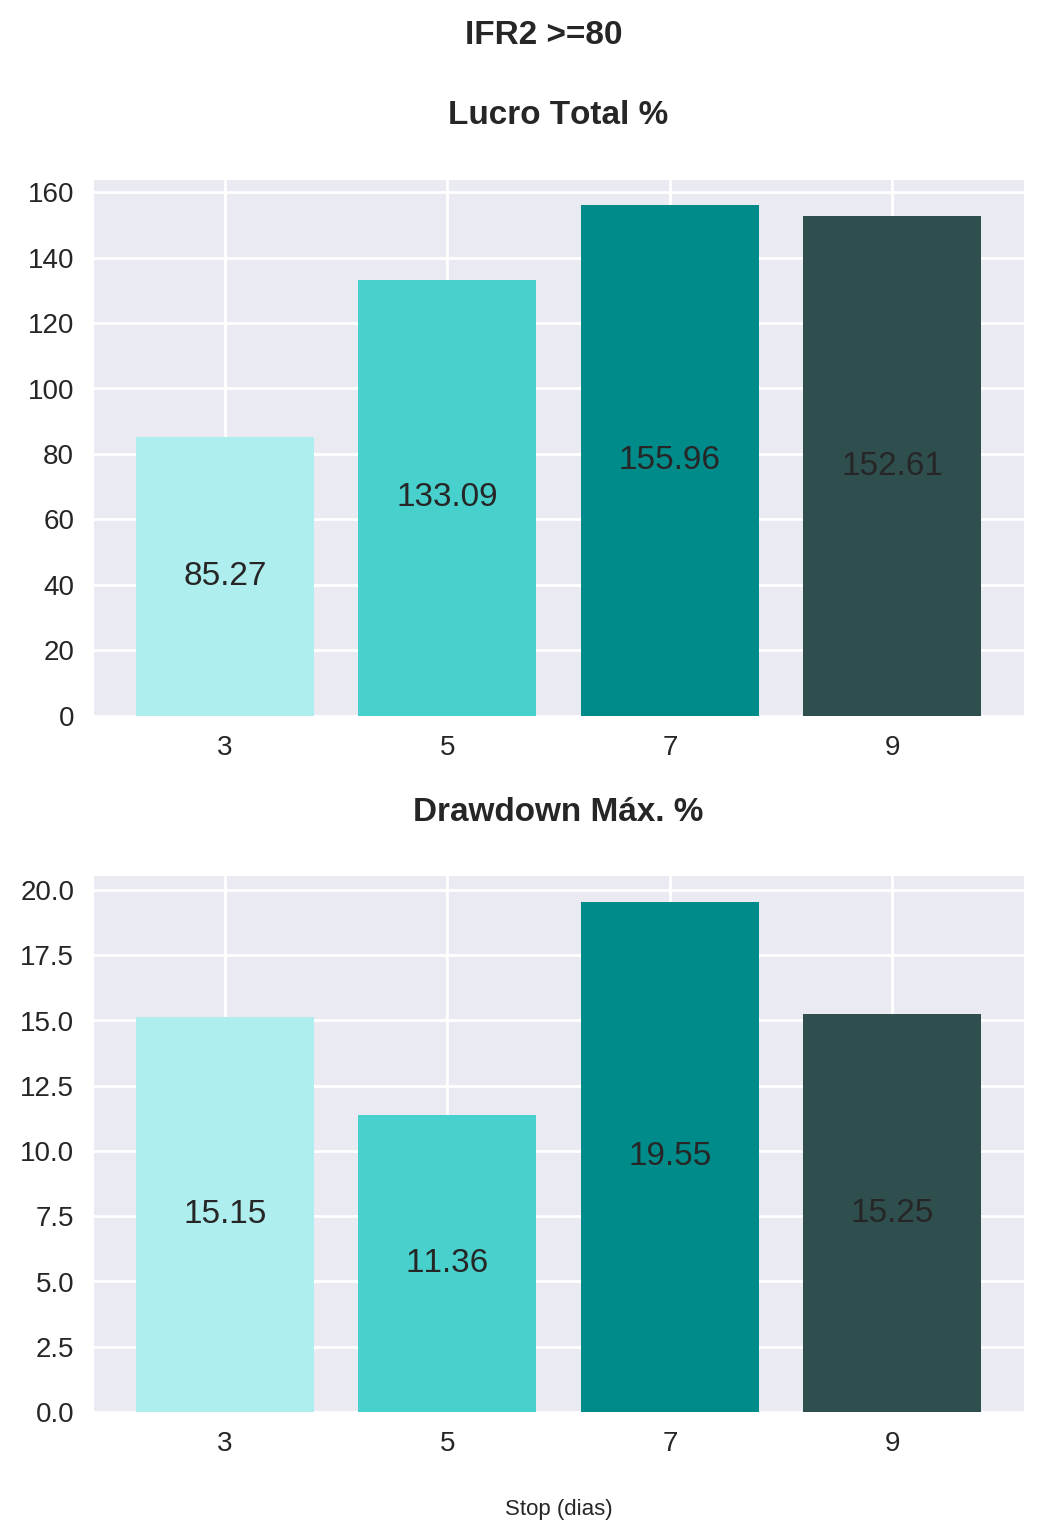
Enfim, iremos plotar o lucro e o drawdown para cada combinação de estratégia alvo/stop. Para isso, vamos atualizar a função plot_bars para retornar ambos os gráficos (ax1 e ax2) em uma única imagem (figure). Esta terá como argumentos:
- o dataframe (
data); - o valor de IFR2 do alvo (
ifr2_target); - o nome das colunas que se deseja plotar (
columns); - o título do gráfico principal (
title); - o subtítulo de cada gráfico (
subtitle); - e a legenda do eixo x (
x_label).
def plot_bars(data, ifr2_target, columns, subtitles, x_label="Stop (dias)"):

  figure, (ax1, ax2) = plt.subplots(2, 1, figsize=(6,8))

  figure.subplots_adjust(hspace=.3)

  colors = ["paleturquoise", "mediumturquoise", "darkcyan", "darkslategrey"]
  ax1.bar(x=data[columns[0]][ifr2_target].index.astype(str), height=data[columns[0]][ifr2_target], color=colors)
  ax2.bar(x=data[columns[1]][ifr2_target].index.astype(str), height=data[columns[1]][ifr2_target], color=colors)

  plt.suptitle("IFR2 >=" + str(ifr2_target), fontweight="bold")
  plt.xlabel("Stop (dias)")

  ax1.set_title(subtitles[0])
  ax1.spines['right'].set_visible(False)
  ax1.spines['top'].set_visible(False)
  for i, v in enumerate(data[columns[0]][ifr2_target]):
    ax1.text(
        x=i,
        y=v/2,
        s=str(v),
        horizontalalignment='center',
        verticalalignment='center',
        fontdict=dict(fontsize=12)
    )

  ax2.set_title(subtitles[1])
  ax2.spines['right'].set_visible(False)
  ax2.spines['top'].set_visible(False)
  for i, v in enumerate(data[columns[1]][ifr2_target]):
    ax2.text(
        x=i,
        y=v/2,
        s=str(v),
        horizontalalignment='center',
        verticalalignment='center',
        fontdict=dict(fontsize=12)
    )
for parameter in parameters:
plot_bars(
data=backtest_df,
ifr2_target=parameter,
columns=["pct_profit", "drawdown"],
subtitles=["Lucro Total %", "Drawdown Máx. %"]
)
Conclusão
Observe que a estratégia com o stop de 7 dias apresentou os maiores lucros, sem diferença significativa no drawdown, para todos os valores de IFR2 de saída. Em contrapartida, o stop de 3 dias performou consideravelmente pior, também em todos os valores de IFR2, sem apresentar melhora consistente do drawdown.
Outro ponto importante é em relação à estratégia com IFR2 de 80, que embora tenha apresentado os maiores lucros com stops mais longos (7 e 9 dias), observou um aumento significativo do drawdown. Isso faz sentido se pensarmos que o êxito da estratégia se apoia no tempo, uma vez que o papel precisa evoluir de um ponto do indicador (<= 30) a outro mais distante (>= 80). Portanto, para estratégias onde o ponto de saída é um valor muito alto de IFR2, trabalhar com um stop baseado no tempo pode não ser a melhor opção.
No próximo artigo, nós iremos analisar como a estratégia se comporta se implementarmos filtros baseados em médias móveis. Fique ligado!
Inscreva-se no canal do QuantBrasil!
Acompanhe novidades sobre a plataforma, vídeos sobre finanças quantitativas, tutoriais sobre programação e Inteligência Artificial!